List and values of wood fuel parameters - Part 1
Wood Fuel Characteristics
A summary of Finnish wood fuel characteristics is presented in Table 2: Finnish wood fuels with typical ranges of variation
Table 2: Finnish wood fuels with typical ranges of variation
Logging residue chips or Harvesting residues (today usually recovered in bundles) have been used in Finland in industrial scale for about 5 years and have been established as a normal fuel component in Finland today. However, it is more expensive than wood wastes originating from forest industries and peat. Harvesting residues are used in amounts that are available at competitive prices. There are many small (< 2 MWth) heating stations in Finland that are using only harvesting residues. Power plants fuel supply is always based on a fuel mix consisting typically of forest industry by-products, peat and harvesting residues to the amounts available at competitive prices.
Table 3: Finnish wood fuels with typical ranges of variation (continued)
In general, the moisture content of wood fuels varies usually from 20 to 65 percent and is influenced, among other things, by the climatic conditions, the time of year, tree species, the part of stem in question and by storage phase. The effect of moisture content on the heating value of wood is clearly defined in Figure 1.
Figure 1: The effect of moisture content on the heating value of wood (kWh/kg)
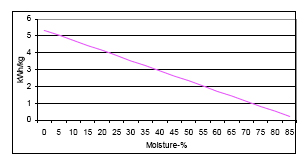
It is thus obvious that the acquisition of energy per M3 of wood fuel increases as the dry matter content per M3 increases and the moisture content decreases. The dry matter content of the chip measure varies considerably. This is influenced by the basic density and the solid volume content of chips. Basic density (kg/m3) indicates the relationship of dry mass to solid volume measure, or how much dry wood weighs per a solid measure of wood.
If a plant has been designed to use moist fuels, no technical problems will occur but high moisture content will impact the overall feasibility of the energy production:
- the more water fuel contains -> lower heating value -> fuel efficiency is lower
- the more water fuel contains -> bigger boiler volume needed -> more expensive boiler
- transportation of water is not feasible Further, most automation systems cannot react to rapid variations in moisture content resulting in incomplete combustion, which increases emissions.